Transform Your Reports with Embedded Power BI: From Static Data to Real-Time Insights
July 3, 2025

Microsoft Power BI is a powerful business intelligence tool that turns data into visually engaging dashboards and reports. Even better, embedded Power BI can be directly placed into your company website or an internal Windows application, making it seamless for your team, clients, or stakeholders to interact with important insights—without ever leaving your platform. This enables you to bring data into the places where decisions are actually made, streamlining productivity and removing friction from the process.
If you’re a business leader, marketer, operations manager, or just someone curious about making smarter use of your data—the team at The Bridge Digital Solutions can help you unlock its full potential.
What Is Power BI?
Power BI is one of the world’s leading business intelligence tools, allowing you to transform raw data into clear, interactive visuals like charts, tables, and graphs. With Power BI, you can:
- Track sales and marketing performance
- Visualize financial data
- Monitor operations and logistics
- View customer insights, trends, and forecasts
Best of all, it connects to your existing data—from Excel spreadsheets and SQL databases to cloud tools like Google Analytics or Salesforce. It acts as a bridge between your raw data and strategic action, enabling real-time analysis at every level of your business.
What Does “Embedded” Power BI Mean?
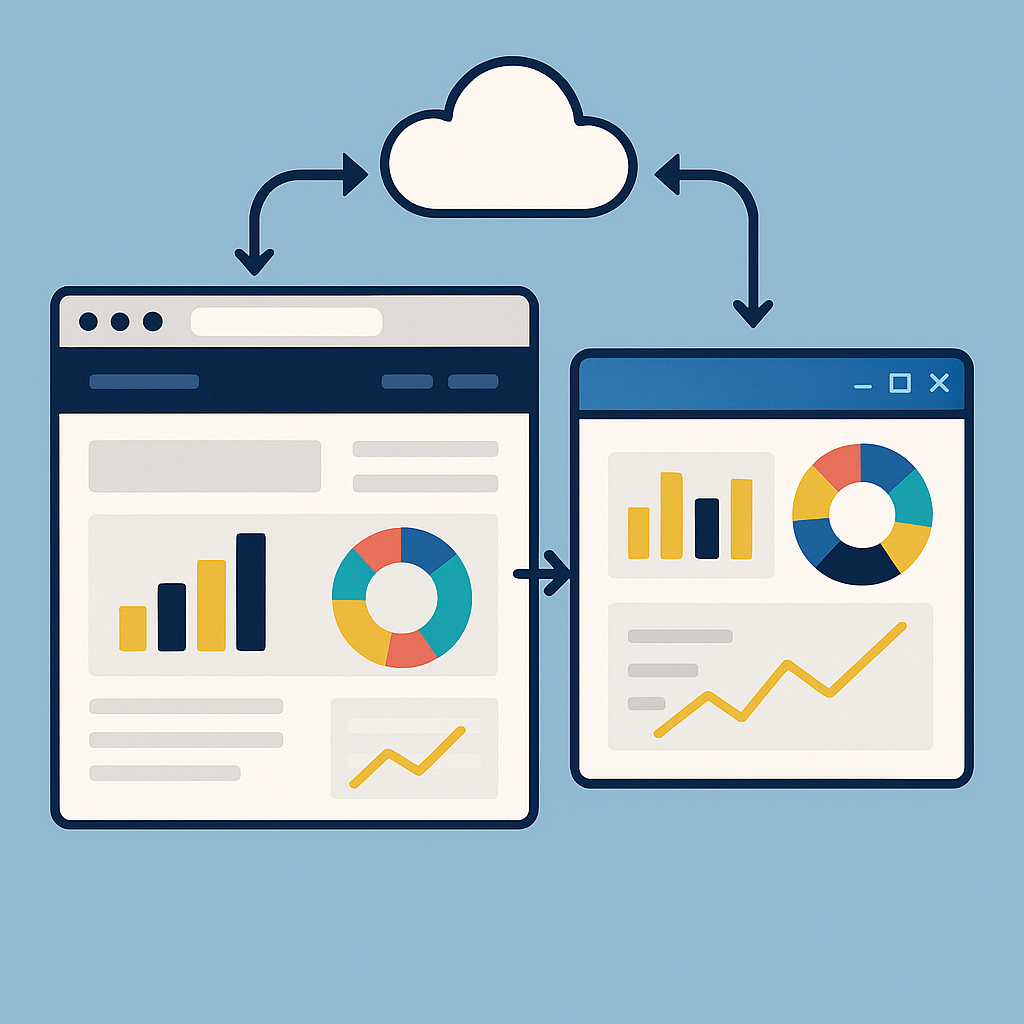
Embedded Power BI means placing a live, interactive report or dashboard inside your own software. Whether that’s a website, customer portal, or internal business app. It looks and feels like part of your system, so users don’t have to jump between tools or log into a separate portal.
There are three main scenarios:
- Public website embedding – You display a report on your public website, perhaps to showcase statistics or industry trends.
- Secure website embedding – Reports and dashboards are placed on your public website but are locked behind a login. Once inside, your clients can view their own data securely.
- Internal app embedding – You place dashboards and reports directly into tools your team uses daily—such as a Windows desktop application or an internal intranet website—giving everyone access to real-time insights.
Why Have Embedded Power BI in Your Website or Application?
Here are the biggest benefits:
1. Deliver Real-Time Insights
When you create embedded Power BI dashboards and reports in your business tools, your team or clients can view live updates instantly—no more waiting for spreadsheets or emailed reports. Everyone has access to the same trusted information, helping teams move faster and make confident decisions.
2. Enhance Customer Experience
If your business offers client portals, adding embedded analytics gives customers access to custom dashboards that display their account status, performance metrics, or usage statistics. They only view the data that is relevant to them, and their situation. This improves transparency and adds value to your digital services.
3. Stay On-Brand
When you embed reports directly into your own applications, you control the look and feel. Everything stays on-brand, professional, and secure—unlike sending people off to a third-party website. It creates a consistent user experience that builds trust and reinforces your identity.
4. Simplify Access to Data
When reports are embedded in your existing apps, users don’t need to open Power BI separately. They get the information they need, when and where they need it. This saves time, reduces confusion, and makes data more approachable—even for non-technical users.
How Is It Secured?
Security is a top concern—and rightly so. Fortunately, Microsoft Power BI uses enterprise-grade encryption and access control. When embedded into your app, you can:
- Require users to log in before viewing reports
- Restrict reports to specific users, groups or roles
- Hide sensitive data based on user access levels or even their company
All of this can be managed behind the scenes, giving your team peace of mind that data is shared securely and appropriately. You maintain full control over who sees what, while ensuring compliance with internal policies or regulatory requirements.
What Does Embedded Power BI Cost?
To create embedded Power BI dashboards into your website or application, you need to purchase a dedicated capacity, which ensures performance, scalability, and secure access. This gives you a permanent online place to host your reports, so they can be accessed from anywhere in the world. Microsoft offers several types of capacity depending on your needs:
1. Power BI Embedded (A SKUs)
Ideal for independent software vendors (ISVs) or developers building customer-facing apps. You pay for the capacity on an hourly basis through Azure, making it great for apps with flexible demand or smaller user bases.
2. Power BI Premium (P SKUs)
Designed for large organisations and internal use at scale. Premium provides a dedicated cloud environment, better performance, larger dataset sizes, and broader feature support. It’s billed monthly and is ideal if you’re embedding for large-scale enterprise use.
3. Microsoft Fabric Capacity (F SKUs)
Part of Microsoft’s next-generation data platform, Fabric supports Power BI and more (like data engineering and real-time analytics). Fabric capacities can be paused while not in use, reducing costs for apps that aren’t accessed 24/7. It’s ideal for internal tools, pilot projects, or variable workloads.
Choosing the Right Option
Each capacity tier is priced based on performance and usage needs. A small app might do well with a lower-tier SKU, while a high-traffic enterprise portal might need a higher SKU with larger dedicated resources and therefore better performance. Cost can be optimized by evaluating usage patterns, user concurrency, and the nature of your reports.
If you’re unsure which route to go, The Bridge Digital Solutions team can help evaluate your needs and recommend the most cost-effective setup.
 An Example of Embedded Power BI in Action
One of our fund manager clients required monthly internal reporting, combined with a cover page dashboard to include in their client quarterly reporting. They also had a selection of fact sheets downloadable from their website in PDF form. We created a Windows Application for them with a suite of embedded Power BI reports to cover all these scenarios. The files are hosted in a Fabric Capacity that is powered down whenever it’s not needed, saving costs.
By embedding these reports, we enabled their team to move away from fragmented tools and static documents. They now have one consistent interface for reporting, analysis, and PDF export. The entire client reporting cycle is faster, more secure, and easier to manage.
Once a user is logged in, they can perform the following actions:
- Spin up their Fabric Capacity
- View a report to ensure data accuracy
- Refresh the data directly in the Fabric Capacity
- Export a full report to PDF or select individual pages
- Export the data behind a report to Excel
- Turn the Capacity off again to save costs
Do I Need a Developer to Set This Up?
Yes—but the good news is, you don’t have to be one. The technical setup is handled by your software team or a provider like The Bridge Digital Solutions, while you focus on deciding what you want to track and how it should look.
Embedded Power BI typically involves:
- Creating the report in Power BI
- Styling it to match your company’s look and feel
- Publishing it to your capacity
- Placing that report into your website or application
- Adding any other controls you might need, such as Refresh or Export to PDF
SEO Benefits of Embedded Analytics
For public websites, embedded Power BI interactive dashboards can improve engagement metrics—like time on site and return visits. These are valuable SEO signals that tell search engines your content is helpful and relevant.
Regularly updating your dashboard with fresh data also keeps your site current—another plus for Google rankings. You’re not just presenting static information; you’re offering a live and dynamic experience that users and search engines love.
Next Steps: Making Your Data Work for You
The Bridge Digital specialises in Power BI dashboard development and embedding. Whether you want to integrate dashboards into your website, a mobile app, or a Windows desktop application—we’ll help you bring your data to life.
We handle the full process:
- Build custom Power BI reports and dashboards
- Securely connect to all your data sources
- Embed reports into your platform
- Provide ongoing support and training
Final Thoughts
Power BI is more than a reporting tool—it’s a way to connect people with the data they need, when and where they need it. By embedding Power BI into your existing platforms, you keep things simple, efficient, and effective. Whether you’re improving internal operations, enhancing client services, or showcasing insights to the world, embedded analytics help you do it better.
It’s not just about better reporting—it’s about transforming the way your business thinks and acts. With embedded analytics, decision-making becomes faster, data becomes more transparent, and teams become more aligned around measurable results. Whether you’re scaling a growing business or modernising legacy systems, Power BI adapts to fit your journey.
With the team at The Bridge Digital Solutions, creating embedded Power BI can be smooth, secure, and effective. We help you turn data into action—and action into results.
And as your business evolves, our solutions grow with you—ensuring you get long-term value and return on your investment, with expert support every step of the way.
Let’s unlock the value in your data—together.
Ready to explore embedded analytics for your business?
Email us today or fill out the form below and let us help you build an Embedded Power BI solution that performs at any size.
