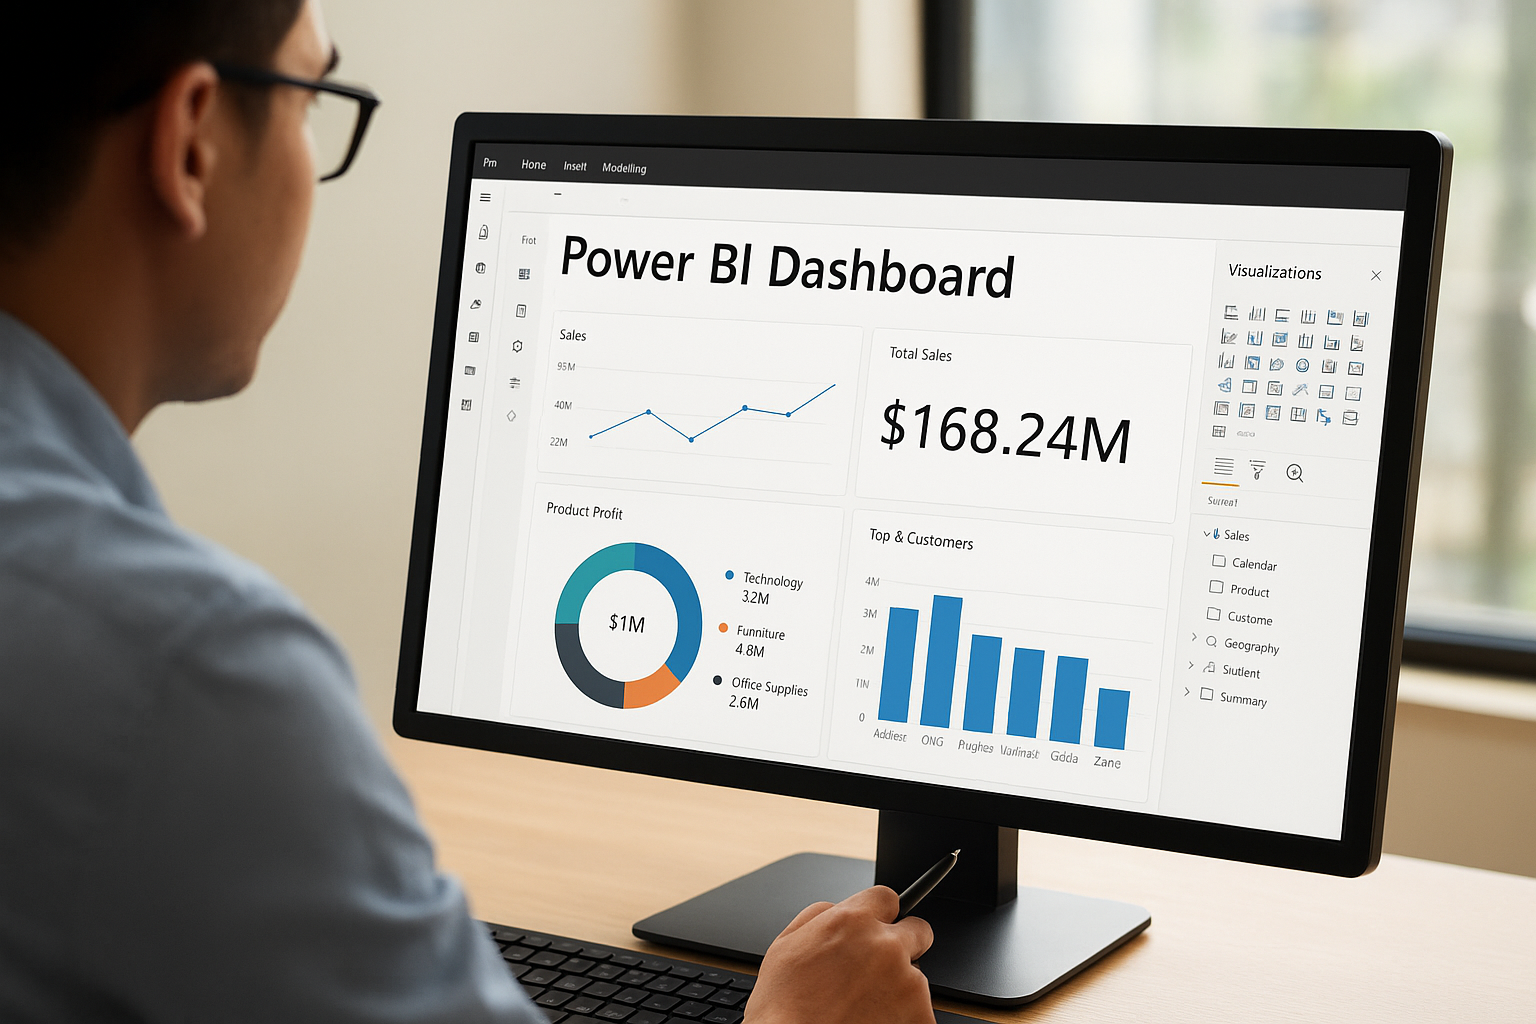
How to Write Better Power BI Dashboard Specifications — and Why a Prototype Can Save You Time
November 12, 2025

Creating Power BI dashboard specifications can feel deceptively simple: you know the data, you know what insights you want, and Power BI gives you the tools to bring them to life. Yet many projects stumble at the very first hurdle — unclear specifications.
At The Bridge Digital, our Sydney-based Power BI experts have helped teams from businesses such as investment management and healthcare transform vague ideas into automated, insight-rich dashboards. The secret? Writing clear, structured Power BI specifications — and using a Power BI prototype to test assumptions early.
Let’s walk through how you can do both.
1. Why Good Power Dashboard BI Specifications Matter
A dashboard specification is your blueprint for success. It aligns everyone — from analysts to executives — around what’s being built and why. Without one, projects risk wasted time, confusing outputs, or misaligned KPIs.
A great specification defines:
The purpose of the dashboard (e.g., performance tracking, financial reporting, or operational monitoring)
The audience and how they’ll use it
Key metrics and data sources
Desired interactivity (filters, drill-downs, etc.)
Update frequency and automation requirements
As Power BI consultants, we often see the biggest issues arise from unclear business goals. A well-structured specification helps teams focus on insight — not just data.
2. Step-by-Step: How to Work Out Your Power BI Dashboard Specifications
Step 1: Define Your Business Questions
Start with what your team needs to know, not what data you have. For instance:
How is fund performance trending over time?
Which clients or portfolios are underperforming?
What operational bottlenecks are slowing delivery?
Each question should map directly to one or more dashboard visuals.
Step 2: Identify and Validate Data Sources
Document where each data point will come from — CRM, accounting system, Excel, SQL, or APIs. Confirm access, quality, and refresh frequency.
Automation depends on clean, connected data — something our Sydney-based Power BI consultants specialise in solving.
Step 3: Define Metrics and Calculations
Avoid ambiguity. If “Revenue” means something different to Finance and Operations, clarify it early.
Include sample formulas or DAX expressions if possible. Our team often collaborates directly with clients to translate complex finance logic into DAX or Power Query transformations.
Step 4: Specify Layout and Design Preferences
It doesn’t need to be pixel-perfect, but outlining visual expectations helps. Indicate:
Layouts (e.g., KPI summary top, trend charts below)
Colour themes (corporate palette)
Device considerations (desktop vs mobile)
A simple wireframe or mock-up goes a long way here.
3. The Value of Building a Power BI Prototype
Even with clear specs, it’s hard to visualise how a dashboard will actually feel until you see it.
That’s where a Power BI prototype comes in.
A prototype is a working model of your dashboard — often using partial data — designed to validate layout, interactions, and logic early in the process. It helps teams:
Visualise requirements before development starts
Identify missing metrics or unclear logic early
Test usability with end users
Gain stakeholder buy-in before full rollout
At The Bridge, we treat the prototype as a collaborative stage — where clients can explore, adjust, and refine ideas in real-time. Once approved, we build the full automated version on top of that foundation.
This process reduces rework, accelerates delivery, and builds confidence in the final outcome.
4. Bringing It All Together: From Power BI Dashboard Specifications to Automation
When your Power BI specification and prototype align, you can move seamlessly into full build and automation.
That includes:
Connecting Power BI to live data pipelines
Implementing scheduled refreshes
Adding security and governance layers
Embedding AI insights such as natural-language summaries
Integrating with Power Automate for report distribution or alerts
Automation ensures your dashboards deliver consistent, up-to-date insights without manual effort — especially critical for finance and funds management teams.
5. Partnering with Power BI Consultants in Sydney
Whether you’re just starting with Power BI or need to enhance existing reports, working with experienced Power BI consultants in Sydney like The Bridge Digital can make all the difference.
We help clients:
Define clear, business-focused specifications
Prototype dashboards quickly to validate ideas
Automate data refreshes and report delivery
Integrate Power BI with CRM, accounting, or investment systems
Apply best-practice governance and data modelling
Our mission is to bridge the gap between business goals and technology — ensuring Power BI works the way your organisation does.
Final Thoughts
A well-written Power BI dashboard specification isn’t just paperwork — it’s your roadmap to insight. Combine it with a thoughtful prototype, and you’ll reduce project risk, speed up delivery, and create dashboards that truly drive decision-making.
At The Bridge Digital, we help businesses across Sydney and beyond do exactly that.
If you’re ready to take your reporting process to the next level, our Sydney-based Power BI consultants can help you turn your ideas into automated, intelligent dashboards.
Contact us today using the form below for a free consultation—and find out more about how to write great Power BI Dashboard specifications.
